| MSA Name |
MSA Abbreviation |
1990 Population |
2010 Population |
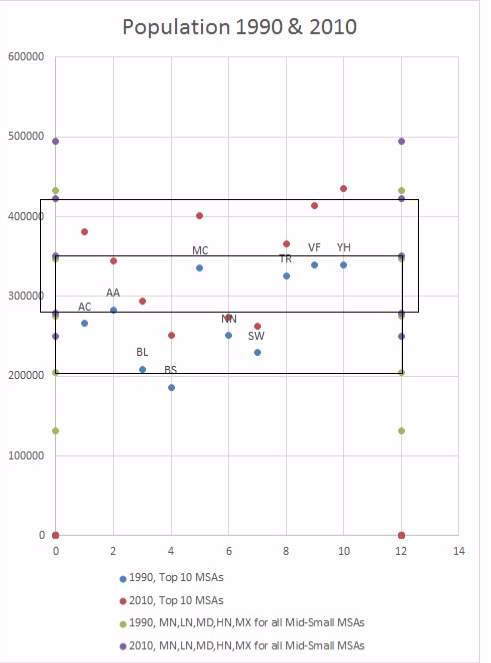
| ANCHORAGE, AK |
AC |
266,016 |
380,821 |
| ANN ARBOR, MI |
AA |
282,937 |
344,791 |
| BOULDER‑LONGMONT, CO |
BL |
208,804 |
294,567 |
| BREMERTON-SILVERDALE, WA |
BS |
186,221 |
251,133 |
| MANCHESTER, NH |
MC |
336,073 |
400,721 |
| NORWICH-NEW LONDON, CT |
NN |
251,099 |
274,055 |
| SANTA CRUZ‑WATSONVILLE, CA |
SW |
229,734 |
262,382 |
| TRENTON, NJ |
TR |
325,824 |
366,513 |
| VALLEJO‑FAIRFIELD‑NAPA, CA |
VF |
340,057 |
413,344 |
| YORK-HANOVER, PA |
YH |
339,574 |
434,972 |
| Minimum (of all Mid-Small MSAs) |
131,821 |
250,304 |
| Low Normal = average minus standard deviation of all Mid-Small MSAs |
204,547 |
278,522 |
| Median (of all Mid-Small MSAs) |
275,625 |
350,573 |
| High Normal = average plus standard deviation of all Mid-Small MSAs |
347,249 |
422,075 |
| Maximum (of all Mid-Small MSAs) |
432,674 |
494,593 |