| MSA Name |
MSA Abbreviation |
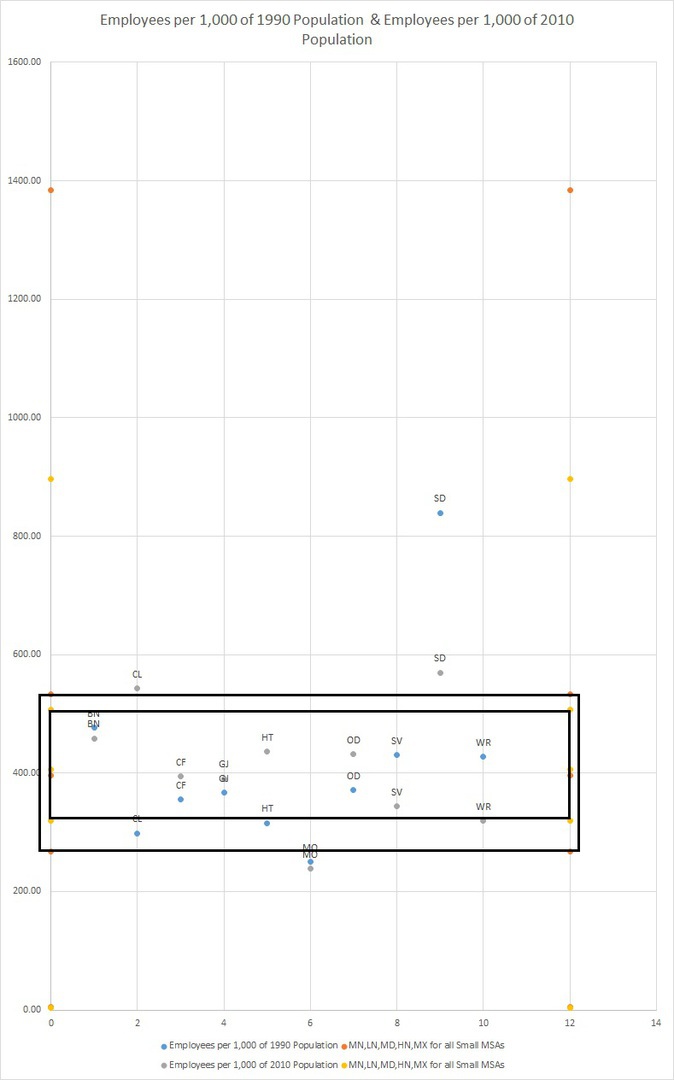
Employees per 1,000 of 1990 Population |
Employees per 1,000 of 2010 Population |
| Bloomington, IL |
BN |
476.74 |
458.42 |
| California-Lexington Park, MD |
CL |
298.56 |
542.73 |
| Crestview-Fort Walton Beach-Destin, FL |
CF |
355.43 |
394.41 |
| Grand Junction, CO |
GJ |
366.92 |
390.73 |
| Houma-Thibodaux, LA |
HT |
315.61 |
436.14 |
| Monroe, MI |
MO |
249.96 |
238.61 |
| Odessa, TX |
OD |
371.27 |
431.67 |
| Sebastian-Vero Beach, FL |
SV |
430.11 |
343.61 |
| Sherman-Denison, TX |
SD |
839.28 |
569.45 |
| Warner Robins, GA |
WR |
427.46 |
319.38 |
| Minimum (of all Small MSAs) |
MN |
4.74 |
4.06 |
| Low Normal = average minus standard deviation of all Small MSAs |
LN |
267.29 |
319.46 |
| Median (of all Small MSAs) |
MD |
396.60 |
406.31 |
| High Normal = average plus standard deviation of all Small MSAs |
HN |
533.50 |
507.02 |
| Maximum (of all Small MSAs) |
MX |
1383.55 |
897.11 |