| MSA Name |
MSA Abbreviation |
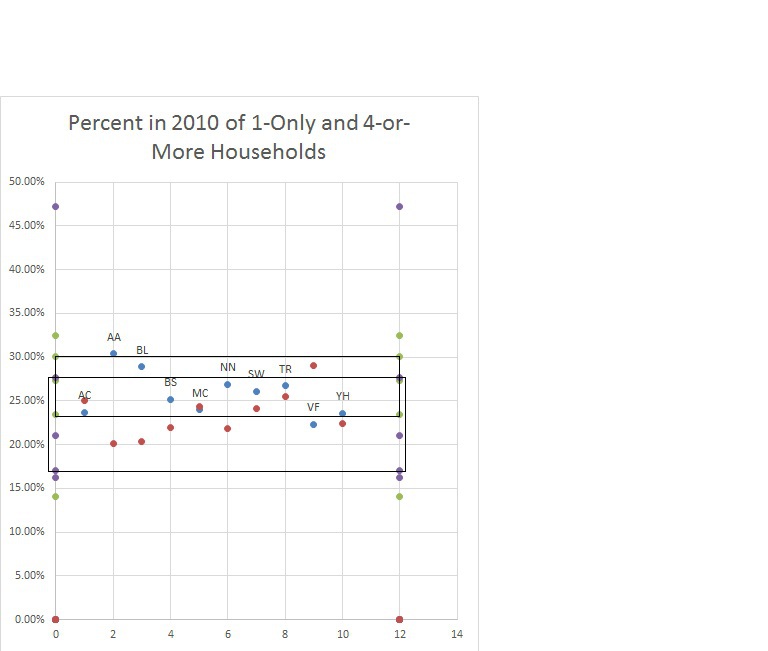
Percent of 2010 Households with One Person |
Percent of 2010 Households with 4 or More Persons |
| Bloomington, IL |
BN |
28.04% |
21.53% |
| California-Lexington Park, MD |
CL |
21.29% |
28.08% |
| Crestview-Fort Walton Beach-Destin, FL |
CF |
26.36% |
18.74% |
| Grand Junction, CO |
GJ |
26.55% |
21.08% |
| Houma-Thibodaux, LA |
HT |
21.37% |
26.82% |
| Monroe, MI |
MO |
23.25% |
24.83% |
| Odessa, TX |
OD |
25.05% |
28.63% |
| Sebastian-Vero Beach, FL |
SV |
25.18% |
21.91% |
| Sherman-Denison, TX |
SD |
27.05% |
21.79% |
| Warner Robins, GA |
WR |
26.25% |
23.60% |
| Minimum (of all Small MSAs) |
MN |
16.54% |
9.59% |
| Low Normal = average minus standard deviation of all Small MSAs |
LN |
23.94% |
17.01% |
| Median (of all Small MSAs) |
MD |
27.50% |
20.45% |
| High Normal = average plus standard deviation of all Small MSAs |
HN |
30.14% |
25.45% |
| Maximum (of all Small MSAs) |
MX |
34.71% |
39.78% |