| MSA Name |
MSA Abbreviation |
Employees per 1000, 1990 |
Employees per 1000, 2010 |
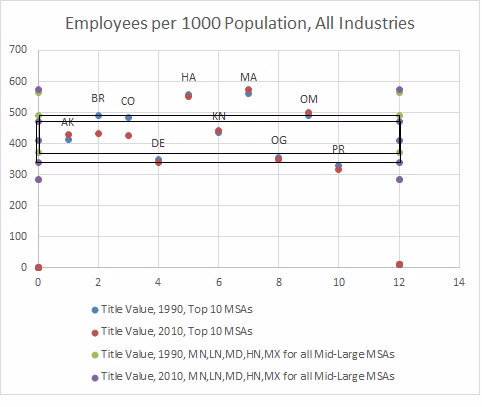
| AKRON, OH |
AK |
414.69 |
429.86 |
| BRIDGEPORT-STAMFORD-NORWALK |
BR |
491.43 |
433.81 |
| COLORADO SPRINGS, CO |
CO |
483.93 |
424.72 |
| DES MOINES, IA |
DE |
347.87 |
337.98 |
| HARRISBURG-CARLISLE, PA |
HA |
558.59 |
553.10 |
| KNOXVILLE, TN |
KN |
434.73 |
441.01 |
| MADISON, WI |
MA |
560.58 |
572.81 |
| OGDEN-CLEARFIELD, UT |
OG |
355.48 |
347.64 |
| OMAHA, NE‑IA |
OM |
488.85 |
501.31 |
| PROVO‑OREM, UT |
PR |
328.80 |
316.06 |
| Minimum (of all Mid-Large MSAs) |
285.30 |
283.15 |
| Low Normal = average minus standard deviation of all Mid-Large MSAs |
369.86 |
340.06 |
| Median (of all Mid-Large MSAs) |
285.30 |
408.66 |
| High Normal = average plus standard deviation of all Mid-Large MSAs |
491.69 |
469.65 |
| Maximum (of all Mid-Large MSAs) |
563.44 |
572.81 |