| MSA Name |
MSA Abbreviation |
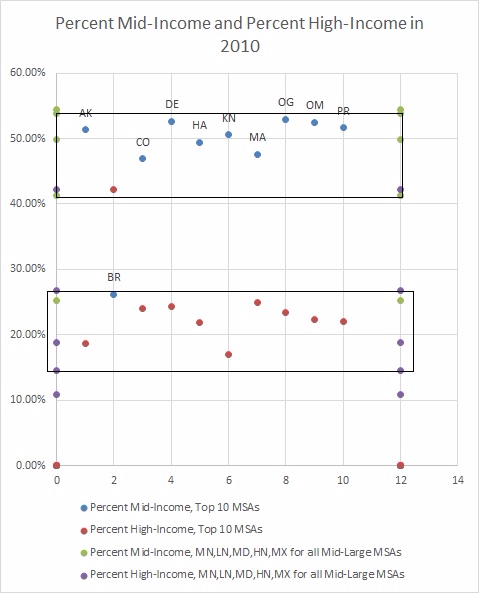
Percent Mid-Income 2010 |
Percent High-Income 2010 |
| AKRON, OH |
AK |
51.37% |
18.59% |
| BRIDGEPORT-STAMFORD-NORWALK |
BR |
26.18% |
42.21% |
| COLORADO SPRINGS, CO |
CO |
46.88% |
23.95% |
| DES MOINES, IA |
DE |
52.62% |
24.30% |
| HARRISBURG-CARLISLE, PA |
HA |
49.40% |
21.87% |
| KNOXVILLE, TN |
KN |
50.55% |
16.99% |
| MADISON, WI |
MA |
47.62% |
24.85% |
| OGDEN-CLEARFIELD, UT |
OG |
52.94% |
23.46% |
| OMAHA, NE‑IA |
OM |
52.50% |
22.27% |
| PROVO‑OREM, UT |
PR |
51.65% |
21.95% |
| Minimum (of all Mid-Large MSAs) |
25.30% |
10.87% |
| Low Normal = average minus standard deviation of all Mid-Large MSAs |
41.25% |
14.59% |
| Median (of all Mid-Large MSAs) |
49.85% |
18.82% |
| High Normal = average plus standard deviation of all Mid-Large MSAs |
53.89% |
26.80% |
| Maximum (of all Mid-Large MSAs) |
54.38% |
42.21% |
| Mid-Income = local equivalent of $30K to $100K |
|
|
|
| High-Income = local equivalent of > $100K |
|
|
|