| MSA Name |
MSA Abbreviation |
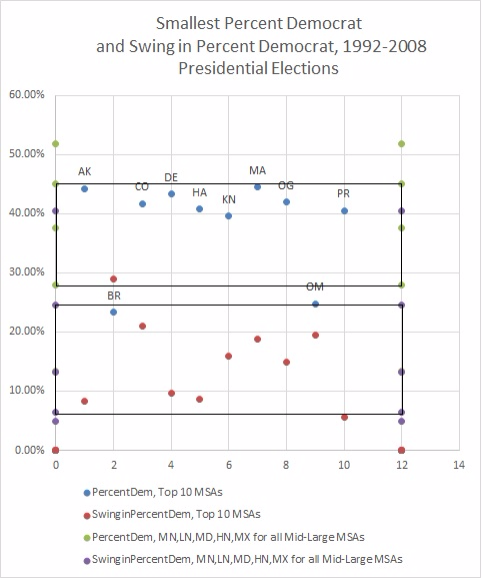
Smallest Percent Democrat, 1992-2008 |
Swing in Percent Democrat, 1992-2008 |
| AKRON, OH |
AK |
44.20% |
8.35% |
| BRIDGEPORT-STAMFORD-NORWALK |
BR |
23.34% |
28.99% |
| COLORADO SPRINGS, CO |
CO |
41.65% |
21.06% |
| DES MOINES, IA |
DE |
43.33% |
9.71% |
| HARRISBURG-CARLISLE, PA |
HA |
40.74% |
8.69% |
| KNOXVILLE, TN |
KN |
39.61% |
15.94% |
| MADISON, WI |
MA |
44.47% |
18.80% |
| OGDEN-CLEARFIELD, UT |
OG |
41.90% |
14.95% |
| OMAHA, NE‑IA |
OM |
24.74% |
19.55% |
| PROVO‑OREM, UT |
PR |
40.50% |
5.67% |
| Minimum (of all Mid-Large MSAs) |
13.43% |
4.87% |
| Low Normal = average minus standard deviation of all Mid-Large MSAs |
28.00% |
6.43% |
| Median (of all Mid-Large MSAs) |
37.59% |
13.12% |
| High Normal = average plus standard deviation of all Mid-Large MSAs |
45.00% |
24.56% |
| Maximum (of all Mid-Large MSAs) |
51.85% |
40.39% |