| MSA Name |
MSA Abbreviation |
1990 Population |
2010 Population |
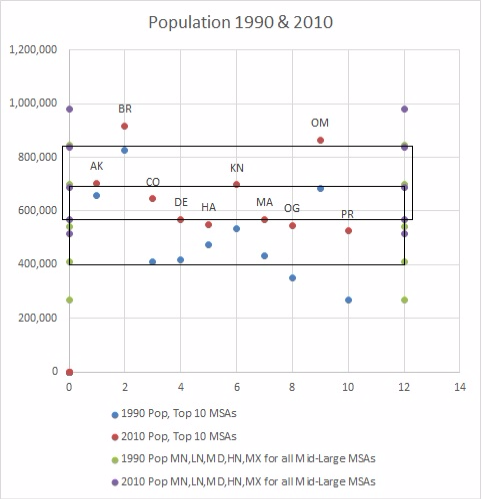
| AKRON, OH |
AK |
657,575 |
703,200 |
| BRIDGEPORT-STAMFORD-NORWALK |
BR |
827,645 |
916,829 |
| COLORADO SPRINGS, CO |
CO |
409,482 |
645,613 |
| DES MOINES, IA |
DE |
416,346 |
569,633 |
| HARRISBURG-CARLISLE, PA |
HA |
474,242 |
549,475 |
| KNOXVILLE, TN |
KN |
534,917 |
698,030 |
| MADISON, WI |
MA |
432,323 |
568,593 |
| OGDEN-CLEARFIELD, UT |
OG |
351,799 |
547,184 |
| OMAHA, NE‑IA |
OM |
685,793 |
865,350 |
| PROVO‑OREM, UT |
PR |
269,407 |
526,810 |
| Minimum (of all Mid-Large MSAs) |
269,407 |
514,098 |
| Low Normal = average minus standard deviation of all Mid-Large MSAs |
409,045 |
567,113 |
| Median (of all Mid-Large MSAs) |
541,754 |
689,124 |
| High Normal = average plus standard deviation of all Mid-Large MSAs |
700,029 |
838,948 |
| Maximum (of all Mid-Large MSAs) |
843,835 |
980,263 |